Business intelligence and reporting software for LBM businesses
Give managers and teams real-time access to sales, margin, customer and operational performance with dashboards, KPIs and reporting connected to the transactions behind the numbers.

How does business intelligence and reporting work in GenetiQ?
Business intelligence and reporting in GenetiQ gives LBM businesses real-time visibility into sales, margin, customers, products, branches and other areas of performance using data already held within the ERP.
Managers and teams can use dashboards, KPIs and interactive reporting to monitor performance, compare results, identify trends and drill into the underlying transactions behind the numbers. Because reporting is connected to the wider GenetiQ platform, users can investigate what’s happening without relying on disconnected reporting systems or manually bringing data together.

Turn ERP data into reporting teams can act on
Use Business Metrics in GenetiQ to monitor performance, compare results and investigate the detail behind key numbers without moving data into separate reporting tools.
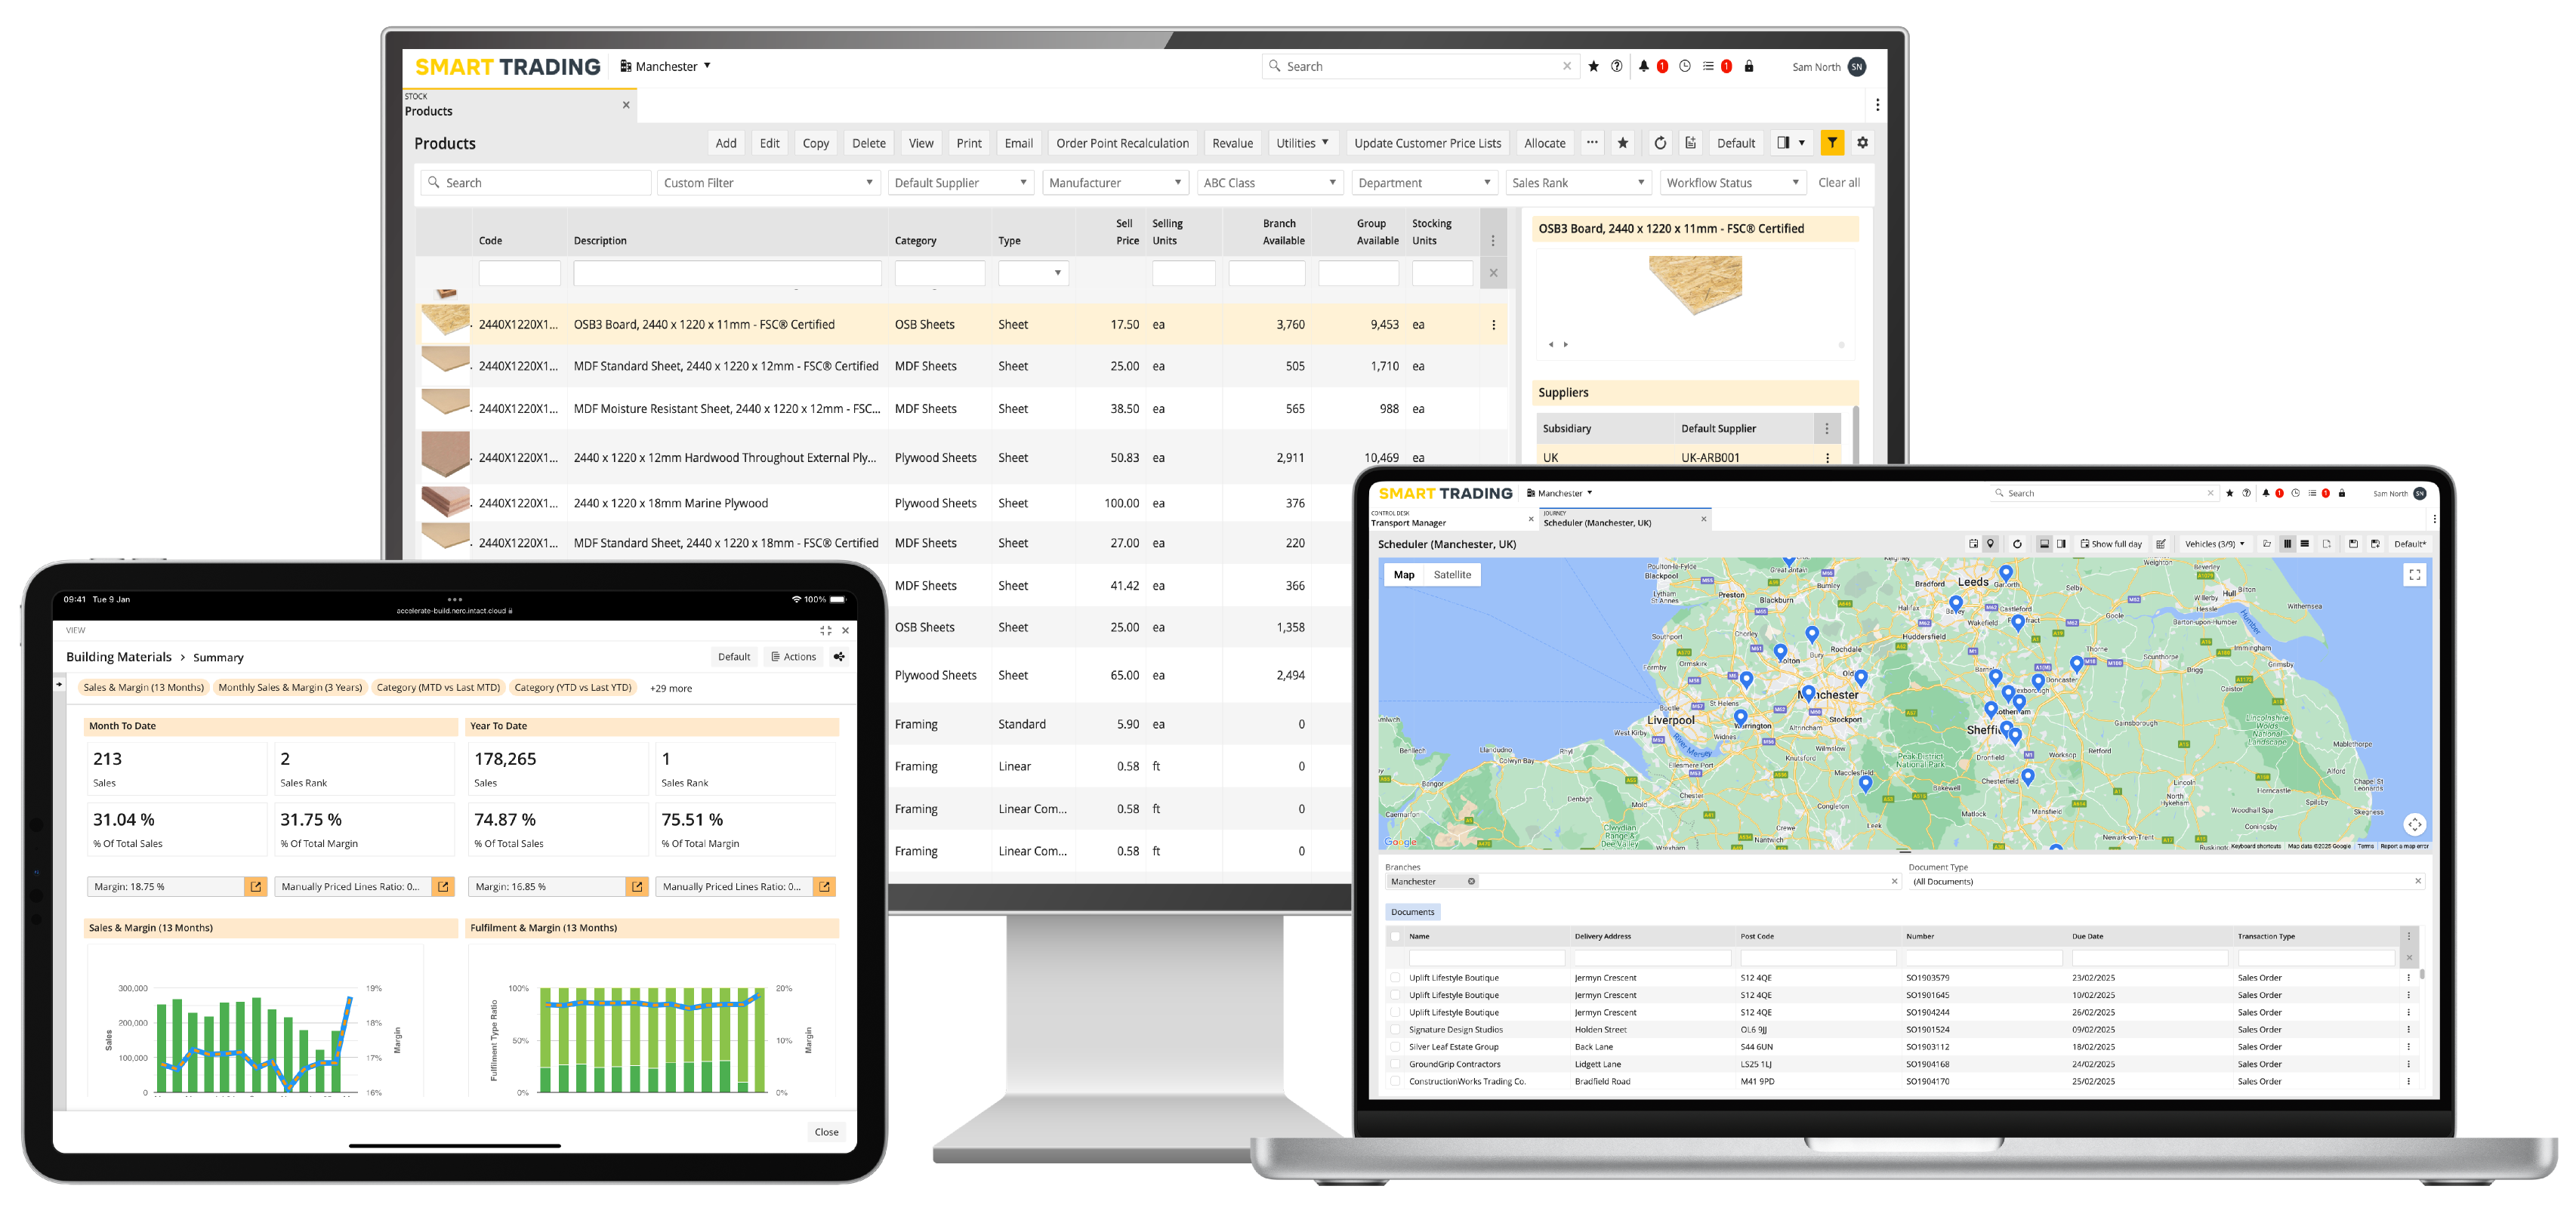
Monitor sales, margin, targets and other business performance measures through interactive dashboards connected to current GenetiQ data.
Give users the flexibility to create role-specific dashboards and views using charts, tables, KPIs, heatmaps and other visualizations without needing coding expertise.
Move from a high-level KPI or summary into the customer, product or transaction detail behind the number, helping teams understand what changed and why.
Compare sales and margin performance across periods, targets, customers, products and sales representatives to identify trends, gaps and areas requiring attention.
Analyze customer profitability, declining spend, product mix and purchasing patterns to identify risks, cross-sell opportunities and potential share-of-wallet growth.
Give managers visibility across teams, branches and areas of the business so they can compare performance, track targets and focus attention where it is needed.
Move from headline performance to the detail behind it
GenetiQ connects dashboards and Business Metrics with the underlying ERP data, helping users move from a high-level measure into the customers, products and transactions behind it — and then into the work that needs attention.
Track sales, margin, targets, customer activity and other business measures through dashboards and Business Metrics.
Identify trends, underperformance, exceptions or opportunities that need closer attention.
Move from a KPI into customer, product or transaction detail, then compare periods, branches, teams or other reporting dimensions to understand what is driving the result.
Use the underlying GenetiQ record or workflow to investigate further and take action without separating the insight from the operational data behind it.
Keep insight connected to the wider business
Business intelligence is most useful when it draws on the same operational data teams use every day. GenetiQ connects reporting with the processes behind sales, finance and branch performance.
Track financial performance, margins and other measures using data connected to the wider ERP.
Compare performance across branches, locations and teams to understand where results differ and where attention is needed.
Analyze sales activity, quotation performance and order trends alongside the transactions driving the results.
Use AI to help interpret business performance
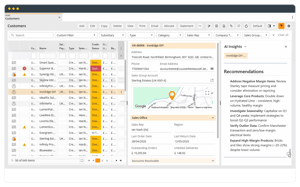
AI Insights works with structured information in GenetiQ to help users interpret performance, identify patterns and surface relevant risks and opportunities in plain language.
It can support teams in understanding changes across customers, products, sales and margin without separating the analysis from the underlying ERP data.
Give teams more confidence in the
information behind their decisions
GenetiQ for LBM businesses

A connected ERP platform for lumberyards, building material suppliers and dealers.
GenetiQ brings the day-to-day areas of your business together, including sales, inventory, purchasing, financials, deliveries and branch operations.
Because reporting and Business Metrics use the same operational data, your teams can move from performance insight into the customers, products, transactions and workflows behind the numbers without switching between disconnected systems.
Frequently asked questions
GenetiQ supports reporting across areas including sales, margin, targets, customers, products, branches and sales representatives.
Business Metrics, dashboards and reporting views help teams compare performance across different periods and areas of the business, while drill-down capabilities provide access to the supporting detail behind headline measures.
Yes. GenetiQ allows users to move from headline Business Metrics and KPIs into the supporting customer, product and transaction information.
This helps teams understand what is contributing to a result rather than relying on summary figures alone.
GenetiQ includes Business Metrics, dashboards and reporting capabilities within the wider ERP platform.
Because reporting is connected to the same operational data used across the business, teams can analyze performance without having to manually bring information together from disconnected reporting systems.
Yes. AI Insights can analyze selected Business Metrics views and help users interpret trends, risks and opportunities in plain language.
It works with the information already available in GenetiQ and is designed to support analysis and decision-making rather than replace the underlying reporting or user judgment.
Ready to turn reporting into clearer action?
See how GenetiQ can help your teams monitor performance, drill into the detail and keep reporting connected to the operational work behind the numbers.