

<img height="1" width="1" style="display:none;" alt="" src="https://px.ads.linkedin.com/collect/?pid=8778010&amp;fmt=gif">
Skip to content

We cater to diverse industries. If your sector isn't listed above, contact our experts to explore potential compatibility.    Are we a good fit →

GenetiQ logo
GenetiQ ERP Laptop and iPad

One ERP platform, available through your browser or desktop application 
with industry-leading personalisation and flexibility.

GenetiQ_XLine_Primary
GenetiQ Xline
Business management software
designed for smaller businesses.

Not sure which GenetiQ product is right for your business?  Compare GenetiQ solutions →


Which business challenges are you trying to solve?
 

Stock and inventory management

Gain real-time visibility and control
across locations and product levels.

Related features:
Warehouse management | Point of sale | Mobile access


Customisation and personalisation

Adapt GenetiQ around your workflows, roles
and business processes.

Related features:
Workflow automation | Mobile access | CRM and marketing


Business intelligence and reporting

Turn live data into clearer decisions with
dashboards and flexible reporting.

Related features:
BI and reporting | Financials and accounting


Sales and order management

Streamline quotes, orders and fulfilment
from counter to delivery.

Related features:
Point of sale | CRM and marketing | Inventory management


Integration and connectivity

Connect your systems, streamline data,
and eliminate manual processes.

Related features:
Workflow automation | Cliqx ecommerce | Clover payments


Financial management

Manage finances, control margins, and
ensure accuracy with confidence.

Related features:
Financials and accounting | BI and reporting

genetiq-cloud-yellow-grey-background-4k
Business intelligence and reporting

Turn business data into clearer decisions and faster action

Bring sales, margin, customer and business performance into connected dashboards and reporting, with drill-down to the transactions behind the numbers and role-focused views that help teams see what needs attention. 

CRM Sales Pipeline Control Desk in GenetiQ showing sales performance, monthly trends, active opportunities, leads and prospects.
Clearer performance visibility
 
Drill down to the detail
 
Turn insight into action
 

See what's happening across the business without piecing reports together

Teams need a clear view of sales, margin, customers, stock and operational performance, but that becomes harder when information sits across separate reports, spreadsheets or systems.

GenetiQ brings Business Metrics, dashboards, control desks and workflow views into the same ERP environment as the underlying transactions, helping users monitor performance, investigate the detail and act on issues without losing context.

Bring performance into one view

Use dashboards and Business Metrics to monitor sales, margin, customer and business performance.

 
Investigate what's driving the numbers

Drill from headline KPIs into customer, transaction and invoice-level detail.

 
Surface work that needs attention

Use control desks and query tiles to highlight overdue work, exceptions and other records requiring action.

 
Drill into the detail

Move from headline performance to the detail behind it

GenetiQ combines analytical dashboards with role-focused workspaces, helping users move from a high-level measure into the customers, transactions and records behind it, then into the work that needs attention.

1
Performance monitored

Track sales, margin, customer and operational measures through Business Metrics and dashboards.

2
Issue or opportunity identified

Spot trends, underperformance, exceptions or areas that need closer attention.

3
Drill into the detail

Move from a KPI into supporting customer, transaction and invoice-level information.

4
Compare and filter

Use reporting periods, business dimensions and filtered views to understand what is driving the result.

5
Work requiring action surfaced

Control Desks and Query Tiles highlight overdue work, exceptions and records that need attention.

6
Action taken in context

Users move from the insight into the underlying workflow or transaction without leaving GenetiQ. 

See sales performance and customer change in one view

The CRM Sales Pipeline Control Desk brings pipeline activity, sales rep performance and declining customer and product trends into one operational view, helping teams identify where performance is changing and where follow-up is needed.

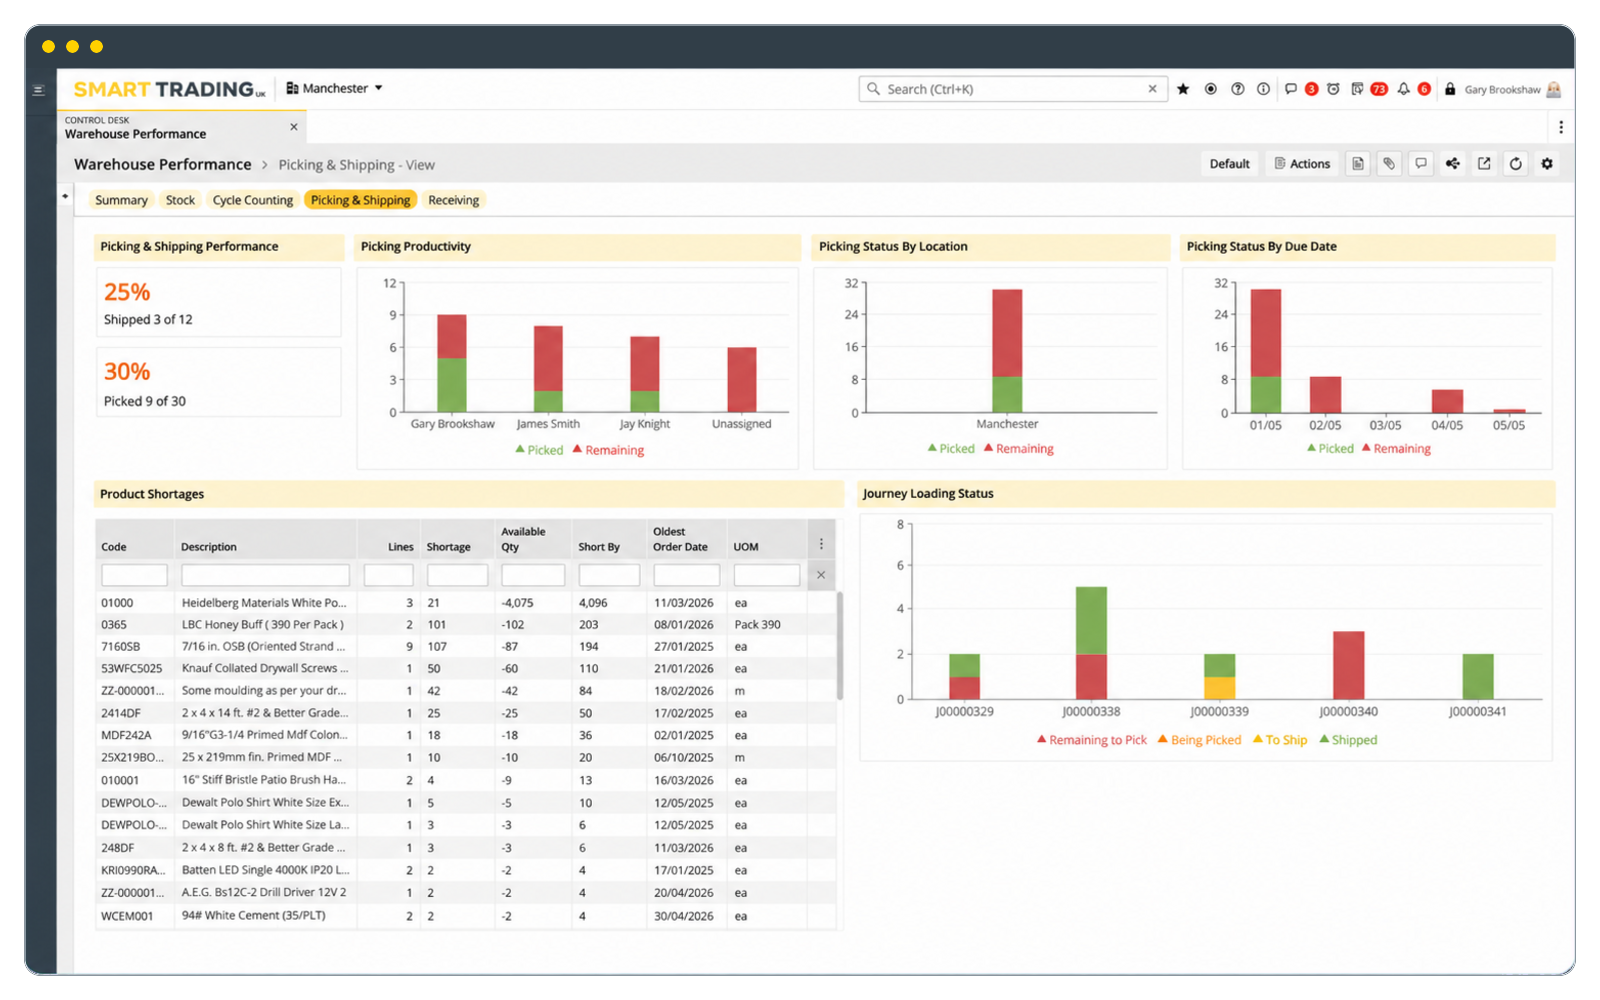
CRM Sales Pipeline Control Desk in GenetiQ showing pipeline activity, sales rep performance and declining customer and product trends.

Give teams clearer visibility from headline performance
to underlying detail

GenetiQ combines Business Metrics, dashboards, control desks and drill-down reporting to help users monitor performance, understand what is driving it and move into the underlying records when action is needed. 


genetiq-warehouse-performance-stylised


Business Metrics

Monitor sales, margin, customer and operational performance through built-in measures, dashboards and reporting views.

Drill-down reporting

Move from headline KPIs into supporting customer, transaction and invoice-level detail to understand what sits behind the numbers.

Role-focused dashboards

Give different users focused views of the measures, trends and operational information most relevant to their work.

Operational exceptions

Use control desks and query tiles to surface overdue work, shortfalls and other records that need attention.

Keep insight connected to the work behind the numbers

GenetiQ brings reporting and operational data together, so teams can move from performance insight into the sales, stock, purchasing and finance activity that's driving it. 

Stock and inventory management

Monitor stock, warehouse activity, shortfalls, transfers and other operational exceptions through connected reporting and workflow views.

Explore stock and inventory management

 
Sales and order
processing

Track sales activity, quotations, pipeline and customer performance, then drill into the records behind the result.

Explore sales & order processing

 
Product, pricing and
margin management

Analyse margin, pricing behaviour, discounts and product performance to see where commercial attention may be needed.

Explore product, pricing and margin
 
bullet-arrow

Turn reporting into faster, better-informed action


By keeping reporting, operational data and workflow activity connected, GenetiQ helps teams spend less time piecing information together and more time understanding what is changing, why it matters and where action is needed. 

Find important information faster

Use dashboards, Business Metrics, control desks and filters to bring relevant performance and operational information into view.

Understand what is driving performance

Drill from KPIs into the customers, transactions and records behind the numbers.

Spot issues and opportunities sooner

Surface declining customers, pricing issues, overdue work, shortfalls and other exceptions that may need attention.

Give each role more relevant visibility

Use personalised dashboards and role-focused workspaces so teams can concentrate on the measures and activity most relevant to them.
Reporting

Create detailed reports alongside dashboards and Business Metrics

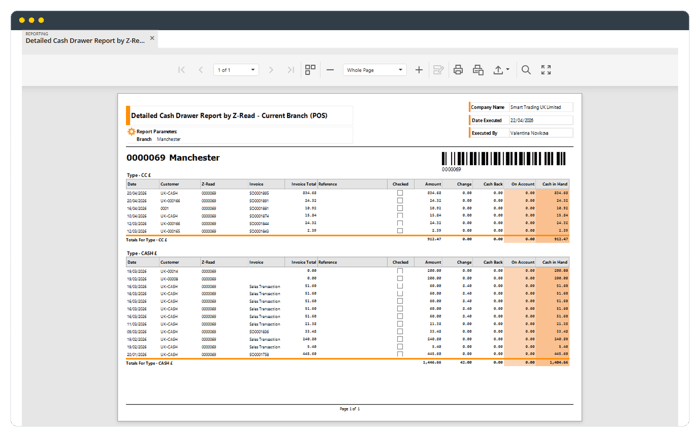
GenetiQ combines analytical dashboards with structured financial and operational reports, giving teams both high-level visibility and the detailed outputs they need for review, control and day-to-day management.


Detailed Cash Drawer Report by Z-Read in GenetiQ, showing grouped transaction and payment information for branch reconciliation.
Financial reports

Use structured finance reports such as aged creditor summaries and detailed creditor reports to review outstanding supplier balances and payment obligations.

Payment and cash reports

Run reports such as Z-Reads and payment-practices reports to review cash-drawer activity, unreconciled journals and supplier payment performance.

Sales and customer reports

Review sales, customer, quotation and performance information alongside Business Metrics and sales dashboards.

Stock and operational reports

Use stock, warehouse and workflow reporting to review inventory activity, exceptions and operational performance across the business.

Add AI-assisted insight to the data already in view

AI Insights works with structured business information in GenetiQ to interpret performance,
identify patterns and surface relevant risks and opportunities in plain language.
AI Insights in GenetiQ showing customer information alongside recommendations based on sales, margin and product performance.
Summarise performance

Turn the information already in view into a clearer summary of what is changing and where attention may be needed.

Highlight risks and opportunities

Surface potential issues and opportunities around areas such as margin, product performance and customer activity.

Support the next decision

Use AI-generated recommendations alongside the underlying ERP information, while keeping the user in control of what action to take. 

Give teams more confidence in the
information behind their decisions

GenetiQ brings reporting, data and workflow activity into the same ERP environment, helping teams work from clearer information and investigate performance without relying on disconnected reports or spreadsheets. 

“The reporting is phenomenal, in terms of the ability to slice and dice data at your fingertips without relying on someone in our IT department to build reports.”
AW-Champion-logo-1000x600-1-1
Glen Murphy, Operations DirectorChampion Timber
“Reports used to be run on spreadsheets. We used to print everything off the system so we were quite paper-based. Our consultant changed our mindset and showed us that we didn’t need to work outside the system or print reports, picking lists etc. We actually don’t use Excel for anything anymore.”
Newline Cleaning & Hygiene Supplies
Freddie CoburnNewline Cleaning & Hygiene Supplies

"We were actually staggered by what the numbers were showing us. You think you’re selling a lot of something when you’re not. This information is so easy to find and helps us make more informed decisions.”

 

hbps herne bay truck
Adam Baker, Managing DirectorHerne Bay Plumbing & Bathroom Supplies
GenetiQ solutions

Business intelligence and reporting in GenetiQ

Business intelligence and reporting sits across the wider GenetiQ platform, combining Business Metrics, dashboards, control desks, workflow views and drill-down reporting with the operational data already held in the ERP.

For businesses that need clearer visibility across sales, margin, customers, stock, purchasing and operational activity, GenetiQ helps users monitor performance, investigate the detail behind the numbers and move from insight into the underlying work.

For businesses of any size

GenetiQ

GenetiQ Multiscreen for Website-1

A flexible ERP platform for merchants, wholesalers and distributors that brings core business operations together in one connected system.

Where the access method matters, GenetiQ is available through a browser application or desktop application. Both are part of the same GenetiQ platform.

For smaller businesses

GenetiQ Xline

Xline with MWS 2

GenetiQ Xline is a separate business management solution designed for smaller businesses with less complex requirements.

Frequently asked questions

What is business intelligence and reporting software? Business intelligence and reporting software helps businesses monitor performance, analyse trends and understand the detail behind key measures. In GenetiQ, reporting sits alongside the operational data and workflows in the ERP, so users can move from dashboards and KPIs into the records behind them. 
What is Business Metrics in GenetiQ? Business Metrics is GenetiQ’s built-in reporting and analytics capability. It brings together measures, KPIs, dashboards, reporting periods and business dimensions such as customers, products, branches and sales representatives, with drill-down into supporting detail. 
Can users drill down from KPIs into transaction detail?

Yes. GenetiQ supports drill-down from headline Business Metrics into underlying customer and transaction information, helping users understand what is contributing to the result rather than relying on summary figures alone.

Can GenetiQ show sales and margin performance?

Yes. GenetiQ supports reporting across areas including sales, margin, targets, customers, products and sales representatives, helping commercial teams compare performance and identify where closer investigation may be needed.

Does GenetiQ include AI-assisted reporting insights?

Yes. AI Insights can analyse selected Business Metrics views and generate summaries and recommendations around trends, risks and opportunities. It is designed to help users interpret the data already in view, rather than replace the underlying reporting or user decision-making. 

Ready to turn reporting into clearer action?

See how GenetiQ can help your teams monitor performance, drill into the detail and keep reporting connected to the operational work behind the numbers. 

Online demo